Supply Chains:
On this page
Prepared by the New Zealand Embassy in Tokyo in collaboration with the North Asia Division in Wellington.
Overview
Japan declared a second state of emergency for the greater Tokyo metropolitan area on 8 January, effective until 7 February. It was later expanded to cover 11 of Japan’s 47 prefectures.
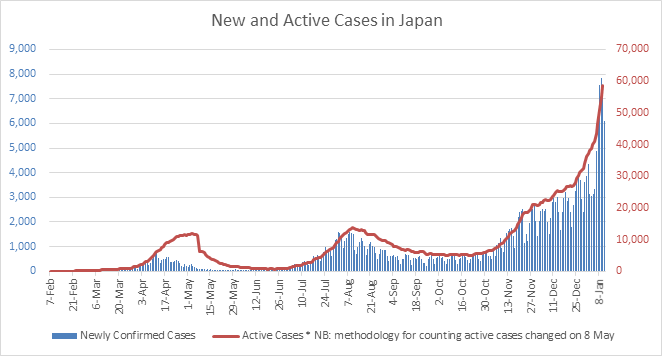
Japan was unable to “bend the curve” of the third wave of COVID-19 infections over the New Year’s break, with record numbers reported almost daily.
The state of emergency is limited in terms of geographical scope and severity of measures, in an effort to minimise its social and economic effects.
The boost from Prime Minister Suga’s NZ$1 trillion stimulus package announced in December is now at risk, with economic commentators predicting the economy could fall back into recession.
In order to fund its successive stimulus packages, the government announced it will issue new bonds worth NZ$1.5 trillion during fiscal 2020, double the amount issued in 2009 after the Global Financial Crisis.
According to Japan’s latest official statistics (November):
- GDP grew 0.5% during the month, a slowdown from October’s 2.5% expansion
- Goods exports fell for a record 24th consecutive month, but Japan still in a trade surplus
- Business and consumer confidence remains pessimistic
- Private-sector demand fell for the first time in three months
- Capital spending and residential investment were both down.
New Zealand’s goods exports to Japan in November were down 2.9% on the same month last year, although year to date (YTD) January-November 2020 goods exports are still up 1.6% on the same period in 2019 due to high volumes of horticulture and honey exports.
Summary
Covid-19: Second state of emergency
Japan’s daily rate of confirmed cases per million people of 50 as of 13 January is still low by international standards(external link). The world’s worst affected countries – such as Ireland, UK, USA and Portugal – are all in the 750-1250 range.
The third wave of infections has put increased pressure on Japan’s medical system.
Japanese-style states of emergency are less rigid than those in many Western countries, relying on voluntary restraint rather than legally enforceable lockdowns.
In contrast to the first state of emergency announced in April 2020, the restrictions of the current state of emergency are not as severe – see table below.
Similar to last year, however, restaurants and bars are requested to stop serving alcohol at 7:00pm, and close at 8:00pm. Prefectural governments are providing “cooperation grants” of up to NZ$800 per day to businesses that comply with requests. Many restaurant and bar owners have reported this financial support is insufficient, and they face bankruptcy.
The government’s COVID-19 expert panel has set criteria for the state of emergency to be lifted. These include the number of weekly cases per 100,000 people dropping under 25, far below Tokyo’s current rate of 46.
Japan has tightened its border settings to reduce the risk of importing cases of COVID-19 and has suspended a short term business travel scheme operating between Japan and 10 other Asian countries with relatively low rates of COVID infection. For details, please check with Japan Immigration(external link), Japan Ministry of Foreign Affairs(external link), or your local Japanese Embassy or Consulate.
| 1st State of Emergency | 2nd State of Emergency | |
|---|---|---|
| Time period | 7 April – 25 May 2020 | 8 January – 7 February 2021 |
| Geographical scope | Initially Tokyo + 6 prefectures, then expanded to all of Japan | Initially Tokyo metropolitan area, now expanded to include 11 prefectures |
| Bars, restaurants | Reduced hours(stop serving alcohol at 7pm; close at 8pm) | Reduced hours(stop serving alcohol at 7pm; close at 8pm) |
| Schools | Closed | Open |
| Gyms, pachinko (slot machines) | Closed | Open, with appropriate precautions |
| karaoke parlours | Closed | Open, no food/drinks served |
| Cinemas, theatres | Closed | Open, with some restrictions |
| Live music / sports venues | Closed | Open, with some restrictions |
Prime Minister Suga’s NZ$1 trillion stimulus package
Last month, prior to declaring the state of emergency, Prime Minister Suga announced a new NZ$1 trillion stimulus package, predicted to boost Japan’s real GDP by 3.6%.
Suga said the package would help Japan cope with the pandemic’s third wave, “maintain employment, keep business going, revive the economy and open a path to growth including through green and digital technology”.
The package includes NZ$550 billion in fiscal spending, with the remaining NZ$456 billion coming from private sector loans and spending leveraged by public funding. The government's direct fiscal spending includes:
- Virus containment measures (NZ$81 billion)
- Structural changes and “positive cycles” for the post-COVID-19 economy (NZ$248 billion):
- NZ$27 billion fund for investment in green technologies as Japan tries to shift to a net zero carbon footprint by 2050;
- NZ$14 billion to promote digital transformation including a new NZ$2.3 billion fund to standardise local governments’ IT systems;
- Improving supply chain resilience and FDI competitiveness;
- Extending subsidies for furloughed employees until the end of February 2021 (NZ$7.4 billion);
- Cash grants for low income and single parent families (NZ$67.8 billion);
- Extending the “Go To” domestic travel subsidy until the end of June 2021 (NZ$14 billion), [this subsidy is now suspended for the duration of the state of emergency]
Disaster management measures (NZ$76 billion)
Reserve funds (NZ$136 billion)
Economic impact of the state of emergency
Japan’s most recent GDP figures show that the economy grew 0.5% during November, a slowdown from October’s 2.5% expansion. Private-sector demand fell for the first time in three months, with capital spending down 0.4% and residential investment down 0.9%.
The continuing third wave of infections and the second state of emergency will slow the economy further, threatening the 3.6% boost to Japan’s real GDP predicted to flow from Suga’s NZ$1 trillion stimulus package.
Many economic commentators have predicted the economy could go back into recession.
Nomura Research Institute’s chief economist Takahide Kiuchi estimated the new state of emergency would decrease domestic consumption by $65 billion, pushing down Japan’s annual GDP by 0.88%. If the state of emergency was expanded to the whole country – as it was last year – then annual GDP would decrease by 2.5%, Kiuchi said.
Mitsubishi UFJ Research senior economist Shinichiro Kobayashi predicted that GDP could shrink by double digits in the first quarter of 2021, which would increase unemployment, and depress consumption.
Economy Minister Hiroshi Kajiyama announced new support measures on 12 January for restaurants and bars affected by the state of emergency – NZ$2,670 for sole proprietors and NZ$5,340 for corporations. This is in addition to “cooperation grants” of up to NZ$800 per day provided by prefectural governments (see above).
There is some evidence that the government’s consecutive stimulus packages are mitigating the worst effects of the economic crisis. For example, corporate bankruptcies fell to a 31 year low in 2020.
Japan Airlines and All Nippon Airlines announced they will further reduce the number of domestic flights, in response to the state of emergency. Their operation rates will reduce to 60% and 66% respectively.
Government spending and debt at record highs
Japan's public debt exceeded NZ$15 trillion at the end of fiscal 2019, more than double its GDP – the highest level among developed countries.
In order to fund its consecutive COVID-19 stimulus packages and to make up for the shortfalls in tax revenue triggered by the pandemic, the government has announced it will issue new bonds worth NZ$1.5 trillion during fiscal 2020. 63 percent of government expenditures this fiscal year will be paid for by the government taking on debt. This is double the amount of new bonds issued in 2009 after the Global Financial Crisis, and marks the first time Japan’s debt issuance has exceeded 100 trillion yen (NZ$1.4 trillion) in a single fiscal year.
The graphs below illustrate this spike in new government bonds, and the resulting increase in Japan’s debt level as a percentage of GDP.
There is no concern about default or debt servicing due to Japan’s 0% interest rates, but concerns about high government debt levels may strengthen the hand of fiscal hawks post-pandemic, resulting in tighter fiscal spending in coming years.
 |
 |
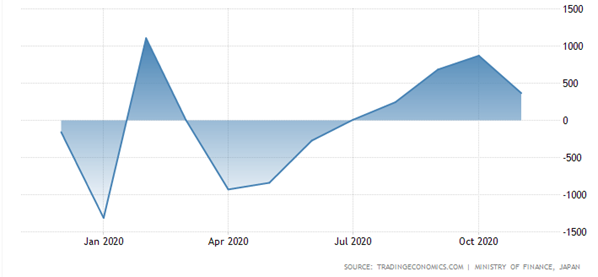
Japan’s goods exports fall for a record 24th consecutive month; but still in trade surplus
Japan’s goods exports decreased 4.2% in November from a year earlier to NZ$82 billion, faster than the 0.2% year-on-year decline recorded in October.
This marked the 24th straight month of declining goods exports, the longest streak on record.
Exports of autos to Europe and the Middle East were sluggish, with the resurgence of global COVID-19 infections suppressing demand.
Japan’s goods imports fell 11% in November from a year earlier to NZ$77 billion, on the back of decreasing prices for oil imports from the Middle East.
Japan’s goods trade surplus was NZ$4.9 billion – remaining in the black for fifth month in a row – but down from NZ$12 billion in October.
In goods trade with the United States, Japan's trade surplus increased 13% year-on-year to NZ$7.9 billion, with exports down 2.5% and imports down 14%.
Japan's trade deficit with China – Japan’s largest export market – increased 21% to NZ$4.3 billion, with exports and imports up 3.8% and 6.7% respectively. Japan’s exports of base paper to China increased 660%, after the Chinese government restricted imports of used paper to reduce environmental pollution.
Japan balance of trade [billions of yen]
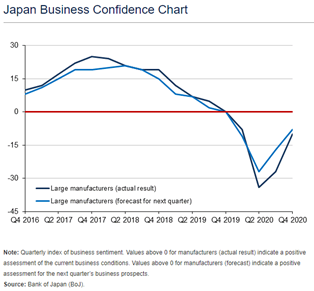
Business sentiment improves in fourth quarter, remains pessimistic
Business sentiment among large manufacturers improved from negative 27 in Q3 to negative 10 in Q4, according to the Bank of Japan’s Tankan (Short-Term Economic Survey of Enterprises in Japan) published in December.
Large non-manufacturing firms’ confidence increased from negative 12 in Q3 to negative 5 in Q4.
While business confidence remained below the threshold (0 points) between optimism and pessimism, the survey indicated that businesses were becoming more positive of a recovery in 2021, although this was before the second state of emergency was announced in January.
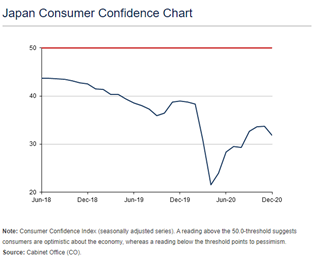
Consumers also increasingly pessimistic
Similarly, the consumer confidence index dropped to 32 points in December, the lowest score since August, amid surging COVID-19 numbers.
The index moved further below the 50-threshold, indicating increased pessimism among consumers when asked about the economy for the coming six months.
All of the main sub-indices deteriorated: consumers were more pessimistic about their overall livelihood, income growth and employment opportunities, and were less willing to buy durable goods.
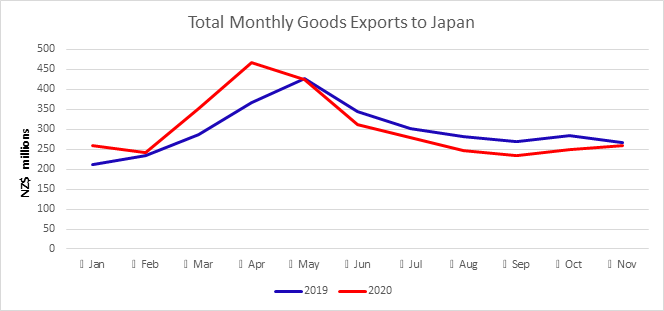
New Zealand goods exports to Japan down 2.9% in November, but up 1.6% YTD
New Zealand’s goods exports to Japan in November were NZ$259 million, down 2.9% on the same period in 2019.
As illustrated below, New Zealand’s goods exports to Japan hit record numbers in March and April 2020 (particularly horticulture exports), but have been down 0-12% since May compared to the same period in 2019.
On a year-to-date (YTD) basis (January-November), goods exports are up 1.6% on the same period in 2019, totalling NZ$3,330 million – a record high since 2010.
As illustrated in the table below, meat and meat products were up 1.4% in November, due to a strong performance by boneless, frozen beef, which increased 33%, compared to November 2019. On a YTD basis, meat and meat products are up 12% to NZ$366 million.
Demand has been high in Japan for healthy foods in 2020 partly due to COVID-19. In November, horticulture was up 35%, with kiwifruit up 54% compared to the same month the previous year. Honey was up 11% compared to November 2019.
On a YTD basis, horticulture, dairy and miscellaneous F&B (e.g. honey) are all up:
- Horticulture is up 21% to NZ$895 million YTD, with large YTD increases from kiwifruit (+19%), pumpkins, squash and gourds (+51%), apples (more than doubled).
- Dairy is flat at NZ$697 million YTD, with a large YTD increase in natural milk products (+72%), but YTD decreases in fresh and curd cheese (-30%) and butter (-24%).
- Miscellaneous F&B is up 12% to NZ$216 million YTD, with honey up 97% to NZ$98 million YTD.
Fisheries exports decreased 49% to NZ$4 million in November, compared to the same period last year. On a YTD basis, fisheries exports have been affected by the Japanese public eating out less during the pandemic, and are down 26% to NZ$63 million compared to January – November 2019.
Forestry products were severely affected in Q2 due to the lockdown in New Zealand, limiting production, and demand in Japan has been hit by the slow-down in housebuilding. Forestry and wood products were down 12% in November, and down 19% YTD to NZ$308 million.
Metal and metal products are down 13% YTD to NZ$482 million. New Zealand metal exports to Japan are mostly aluminium which is used in production of computer equipment and autos. Japan’s auto exports have been hit by the global slow-down.
As we have reported in previous months, about 20% of New Zealand’s exports to Japan are tourism and education services which have been severely impacted by the border closures in New Zealand.
November and YTD New Zealand Goods Export to Japan by Industry Comparison
| Rank | Industry | November 2020 | ||
| $Millions | %Change | %Share | ||
| 1 | Dairy | 62.9 | -9.8 | 24.3 |
| 2 | Metal and metal products | 51.1 | -2.8 | 19.8 |
| 3 | Horticulture | 41.5 | 34.6 | 16.1 |
| 4 | Forestry and wood products | 28.0 | 1.4 | 10.8 |
| 5 | Meat and meat products | 25.8 | -11.5 | 10.0 |
| 6 | Miscellaneous F&B products | 17.0 | -31.9 | 6.6 |
| 7 | Fisheries | 4.0 | -48.5 | 1.5 |
| Subtotal of leading industries | 230.3 | N/A | 89.1 | |
| Other goods | 28.2 | N/A | 10.9 | |
| Total | 258.5 | -2.9 | 100.0 | |
| Rank | Industry | Year to date (Jan–Nov 2020) | ||
| $Millions | %Change | %Share | ||
| 1 | Horticulture | 895.3 | 21.1 | 26.9 |
| 2 | Dairy | 696.7 | 0.2 | 20.9 |
| 3 | Metal and metal products | 482.2 | -12.8 | 14.5 |
| 4 | Meat and meat products | 366.1 | 12.4 | 11.0 |
| 5 | Forestry and wood products | 307.6 | -19.2 | 9.2 |
| 6 | Miscellaneous F&B products | 215.6 | 11.8 | 6.5 |
| 7 | Fisheries | 62.8 | -26.2 | 1.9 |
| Subtotal of leading industries | 3,026.3 | N/A | 91.0 | |
| Other goods | 300.4 | N/A | 9.0 | |
| Total | 3,326.7 | 1.6 | 100.0 | |