Food and Beverage, Primary Products, Manufacturing (excludes F&B):
On this page
Summary
- Export growth slowed in the year to September as the post-pandemic recovery in services continues to run its course and an economic slowdown in China weighed on goods exports. Exports grew 2.8% to reach $98.9 billion in the September year, far slower than the 12.2% jump recorded a year ago.
- There were some positives in the export data. A resilient US economy has helped to partially offset weaker demand elsewhere. For instance, meat exports to the US, dominated by strong demand for beef, rose 18.8% to $2.5 billion over the year. Kiwifruit and apple exports also had a particularly strong year, as favourable growing conditions and decent global prices supported growers returns.
- New Zealand imports fell 4.3% to $106.2 billion in the twelve months to September. Tough economic conditions here at home have weighed on demand especially for durable goods imports, such as machinery and vehicles.
- Despite the weak performance, on the surface New Zealand’s trade outlook is brighter than it has been for a while. Exports in 2025 are expected to benefit from the recent strength seen in global commodity prices, a weaker New Zealand dollar, and rising primary production. On the import side, an expected recovery in the domestic economy in 2025 is likely to lift demand.
- However, clouding the trade outlook is a likely increase in global trade protectionism exacerbated by a change in the US administration. Increased trade protectionism poses a significant risk to the global economy and New Zealand’s export growth.
Report
Export growth has slowed, and the pace of import decline has moderated
Export growth slowed and the recent slump in imports may be soon coming to an end according to September quarter trade data from StatsNZ. The value of exports lifted 2.8% to reach $98.9 billion in the year to September 2024. However, export growth is slowing following a 12.2% jump recorded last year. The post-pandemic recovery in services exports, such as tourism and education, appears close to running its course. Nevertheless, the gains seen in services exports over the last twelve months were still large enough to offset declines in food and fibre exports.
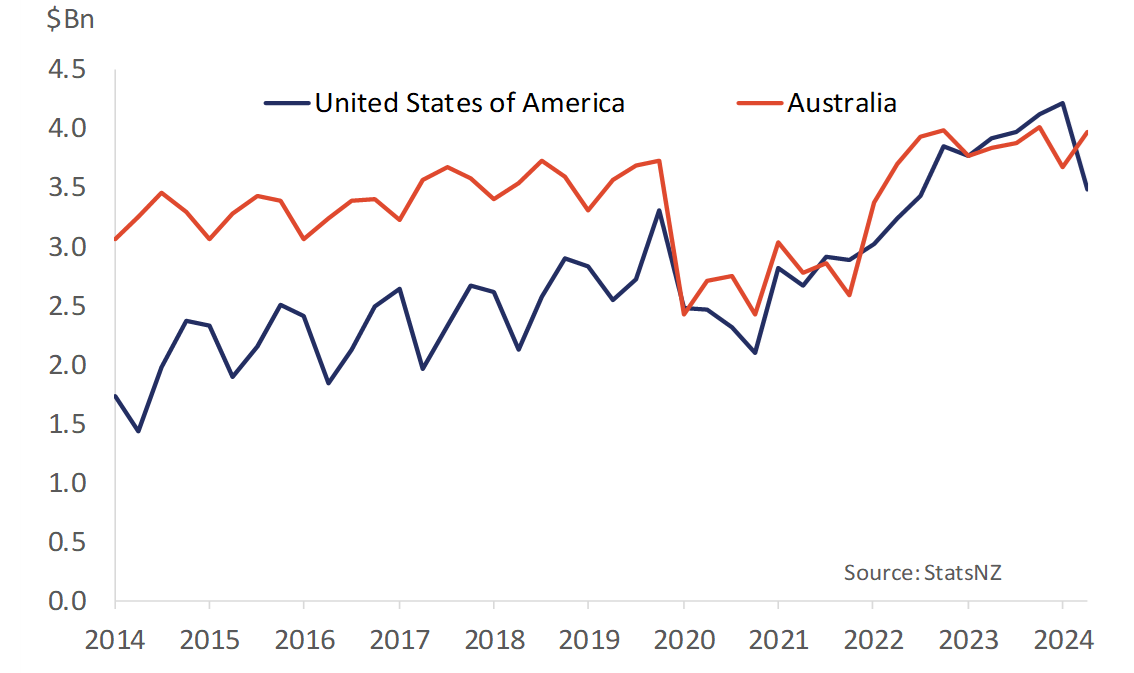
New Zealand’s exports have been hit by weaker demand from China as an economic downturn dented consumer confidence and construction activity. However, a resilient US economy has partially offset weaker Chinese demand and supported demand for beef and tourism exports. On an annual basis the US remained New Zealand’s second largest export destination. However, in the September quarter the US was overtaken by Australia to be our third largest export destination (Figure 1), a move that is likely due to seasonal movements as the September quarter is typically a low for exports to the US.
Figure 1: Quarterly exports to the US and Australia
Food and fibre exports have had a tough year but look to have reached a low point in the current cycle
Despite a strong September quarter gain of 5.7% compared to last year, goods exports for the year to September were 1.4% lower than 2023. Dairy exports came in $1.1 billion below what was recorded in 2023, as an increase in the export volumes of milk powder were more than offset by weaker prices. Similarly, the 3.4% decline in meat exports over the same period was largely driven by weaker average prices. However, underlying the fall in meat exports was a mixed picture in terms of our major markets. Meat exports to the US, dominated by strong demand for beef, rose 18.8% to $2.5 billion. The US has faced tight domestic beef supply at the same time as consumer spending has shown resilience. In contrast, exports to China plunged more than $1 billion over the year as the ongoing economic slowdown in the country led to significant falls in sheep meat prices. Policy stimulus announced by Chinese officials in recent months may support exports to China over the coming quarters.
New Zealand’s exports of wood products continued to reflect the challenging economic conditions in China’s property market. Exports of logs, the vast majority destined for China, fell 2.1% in the year to September. However, in a sign that the value of log exports is finally stabilising, the fall in 2024 was less than the 6.6% and 13.8% drops recorded in 2023 and 2022 respectively.
Finally, elevated global wine stocks and a challenging demand environment in some key markets contributed to a $230 million (10%) decline in wine exports in the year to September.
However, apple and kiwifruit exports have bucked the trend this year
Exports of apples and kiwifruit continued to buck the trend in the September quarter. A total of $4.6 billion of New Zealand fruit was exported in the twelve months to September, up almost 25% from the year before. Our biggest fruit exports, kiwifruit and apples, had a favourable growing and harvest season in 2024, helping to boost volumes. Moreover, prices for fruit exports have generally held up in 2024. Apple exports experienced a strong rebound in volumes this year following the devastation of Cyclone Gabrielle in early 2023. According to StatsNZ export volumes of apples jumped 17.5% in the year to September following an 8% drop a year earlier. The value of kiwifruit exports ($3.3 billion) was 29% higher than last year, with the gold kiwifruit variety being the main driver of rising kiwifruit exports given maturing production and the price premium the variety commands. The European Union ($920 million) regained the title as New Zealand’s largest kiwifruit export market leapfrogging China ($850 million) and Japan ($522 million). Kiwifruit growers will benefit from an expansion in exports to the EU in the coming years, with the EU-NZ FTA – which came into force back in May – providing tariff-free access.
Exports of aircraft engines look to have flown out the door
Mechanical machinery exports also stood out, recording a $102 million (4.3%) gain in the year to September to reach close to $2.5 billion. Underlying this result has been a jump in the exports of aircraft engines in the past six months. The notable increase in engine exports is possibly associated with aircraft engineering and maintenance activities, rather than the manufacturing and exporting of engines from scratch.
Following a rapid recovery in 2023, services exports are settling into a new norm
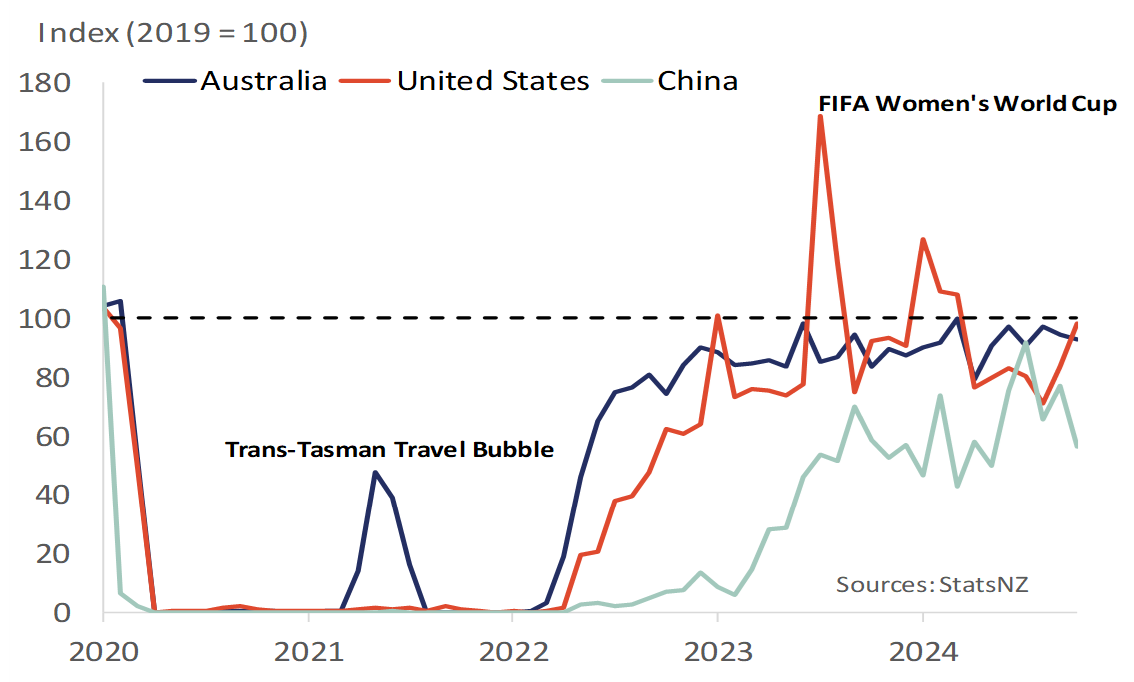
Following the rapid post-pandemic recovery, tourism exports are now settling into its normal rhythm, albeit one that for the time being is below pre-COVID levels. Travel exports came in at around $15 billion in the year ending September 2024, about 4.5% below the value of exports in 2019. However, underneath the headline figure there has been a notable shift in tourism spend in New Zealand. Travel exports to China remain well below pre-pandemic levels (20.9% lower). In contrast, strong travel export revenue growth from Australia and the United States (up 27.9% and 16.3% respectively on pre-COVID levels) has helped support the recovery so far. On a sheer volume basis, visitor arrival data suggests that COVID has led to a lasting drop in tourism growth (see Figure 2). International education on the other hand has seen good recovery from China, with Chinese education related travel representing 35.8% of exports (growing in proportion from pre-Covid levels at 29.3%).
Figure 2: Visitor arrivals from Australia, the US, and China as a share of 2019 levels
A more positive export outlook may be clouded by trade protectionism uncertainty
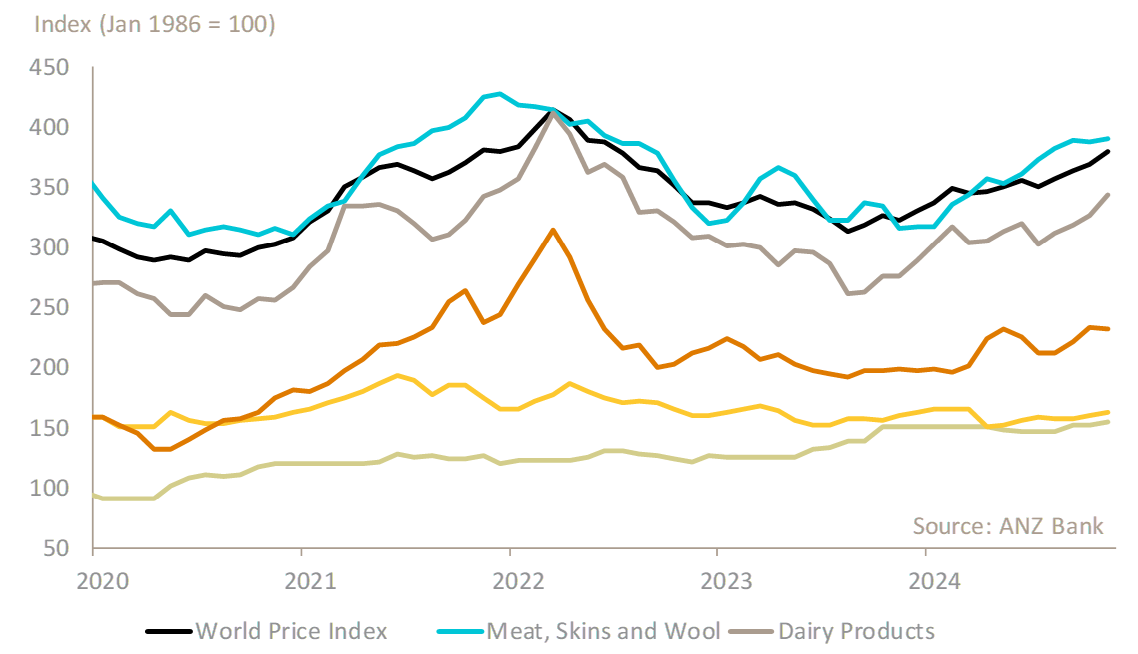
Over the year ahead, there are signs that the value of exports is set to strengthen as a result of improving commodity prices, a weaker New Zealand dollar, and rising primary production. Global commodity prices have generally been trending higher this year, and rising prices should support New Zealand’s primary exports (see Figure 3). Global dairy prices for example have recorded steady gains in 2024 and since January, the headline price index on the Global Dairy Trade has lifted 22%. Global demand for dairy appears to be recovering at a time that supply remains constrained in some major producing markets. Citing strong Chinese and Southeast Asian demand, New Zealand’s largest dairy producer Fonterra has recently raised its projected payout prices range for the current season (to June 2025) by 50c to $10/kgms. The payout, if realised, would represent a record payout in Fonterra’s history. However, adjusted for inflationary pressures the payout would only just make Fonterra’s top five of the last 25 years given the major on-farm cost increases experienced over the last few years.
Figure 3: Global prices for New Zealand’s primary exports have strengthened
The New Zealand dollar has fallen sharply in recent months, which should further boost the New Zealand dollar price of exports and increase New Zealand’s export competitiveness. Trading around USD0.63 back in late September the Kiwi is has now fallen to around USD0.57. The weaker New Zealand dollar can be partially attributed to US dollar strength, which was given a boost from the decisive US presidential election result. However, a bigger factor at play has been the sharp fall in New Zealand interest rates relative to other jurisdictions. Since August, the Reserve Bank of New Zealand (RBNZ) has cut the official cash rate (OCR) aggressively by 125 basis points, as inflation has fallen quickly back to target and spare capacity is evident in the economy. In contrast, a more resilient US labour market in 2024 and concerns of possible inflation pressure building in 2025 has seen the US Federal Reserve tone down the expected pace of its interest rate cuts. At 4.25%, New Zealand’s official cash rate sits below the Fed funds rate, and in November the OCR fell below the Australian cash rate of 4.35%.
Finally, production in most primary sectors is expected to strengthen over the coming year. Looking at dairy for instance, favourable conditions this season to date has led to the highest third quarter volume of milk collections since 2020 according to DCANZ. On-farm milk production was up 3.2% over the six months to December compared to the same period in 2023. One exception in the primary sector is sheep meat, with MPI noting in its latest SOPI report a shrinking national flock and lower lambing rates are likely to weigh on export volumes ahead. Despite this, stronger lamb prices next year are expected to provide a partial offset. In their latest Half-Year Economic and Fiscal Update, the Treasury noted “Primary production has increased, particularly in dairy and fruit industries, and export prices have firmed”. As a result, the Treasury is predicting that goods export volumes should strengthen from next year.
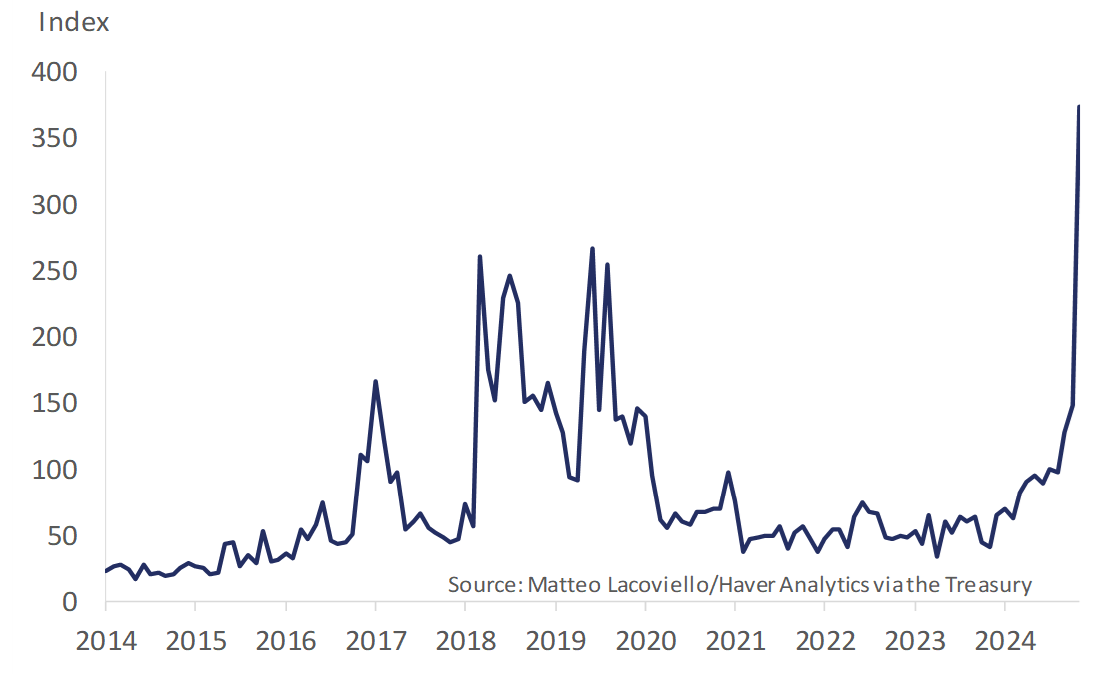
However, the likely increase in global trade protectionism in 2025 is casting a shadow over New Zealand’s trade performance outlook. A change in administration in the US, as well as trends toward rising trade protection globally, has seen measures of trade policy uncertainty surge in recent months (Figure 4). An Executive Order signed by President Trump on his first day in office tasked key economic agencies to prepare a series of reports for the President by 1 April 2025. At this point, additional tariffs have not been announced, although President Donald Trump has publicly noted the possibility of increased tariffs on imports from a number of countries including Canada, Mexico and China. The potential for tit-for-tat tariff hikes between major economies is a key risk to the global economic growth and New Zealand’s exports.
Figure 4: Trade policy uncertainty index - A major unknown for 2025
Imports perked up in the September quarter, led by travel services
Imports fell 4.3% in the year to September to reach $106.2 billion. Tough economic conditions at home have weighed on demand for durable goods imports, such as machinery and vehicles. But despite the annual fall, growth in imports showed some pep in the quarter by being 3.3% higher than the same time last year. Services recorded a solid increase (up 7% YoY), led by imports of travel and transport services. Goods imports were also up in the third quarter with notable increases in petroleum and aircraft imports. However, it’s too early to suggest that rising imports is a sign that domestic spending is picking up. September quarter GDP data surprised markets by falling 1.0% in the September quarter and a cumulative 2.1% over the second and third quarters – the largest two-quarter fall in GDP since the early 1990s. Nevertheless, we would expect to see imports posting modest gains in the coming quarters as an expected economic recovery from the post-pandemic slowdown develops. The Treasury latest economic update noted that falling interest rates will help support a pickup in GDP growth in 2025. The economy is forecast to expand by 2.1% in 2025 from next to no growth this year.
Imports of services in the twelve months to September rose $1 billion (3.3%) driven by the ongoing lift in spending by New Zealanders on international travel. However, there was an increase in the number of short-term New Zealand resident departures in the September quarter, although departures were 6% below levels recorded in the same quarter of 2019. This suggests that New Zealanders are having to spend more to travel. Internationally, services inflation has been notably sticky despite overall inflation being brought down to or near target in many developed economies. Spending on business-related services also contributed to rising services imports. With annual gains recorded in ICT, charges for the use of intellectual property, and other business services.
Goods also contributed to an increase in imports in the September quarter
Goods imports posted a $364 million gain compared to the same period last year, although were 7.1% down over the September year. A jump in petroleum imports was a feature of September quarter data, posting a chunky 17% YoY rise. Higher imports of petrol were driven by increased imported volumes rather than prices, with StatsNZ recording a seasonally adjusted 27% jump in fuel volumes over the quarter. In contrast, fuel prices fell over the quarter with petrol prices dropping 6.5% to be down 8% on a year earlier. Contributing to the lower petrol price, global oil prices (the biggest cost driver of refined petroleum) have fallen steadily over much of 2024 from April’s peak of around US$87/barrel having bottomed out at US$66/barrel in September. In addition, a stronger New Zealand dollar over the September quarter is likely to have helped lower the landed price of fuel in Aotearoa. Looking ahead, however, the same can’t be said for the December quarter with global oil prices having stabilised and the New Zealand dollar having fallen steadily over the past three months.
Another feature of the September quarter was a jump in aircraft imports, primarily from the United States, recording a $290 million gain compared to the same period last year. Imports of aircraft are typically lumpy and driven by the major investment programmes of airlines or the defence force. Over the September quarter three of five brand new C-130 Hercules aircraft for the Royal New Zealand Airforce landed in the country. The total programme to replace older models of these aircraft has been valued at $1.5 billion, which includes support equipment such as a flight simulator. The final two Herks are expected to touch down in New Zealand before the end of the year and therefore should be picked up in the December quarter trade figures.
Mechanical machinery imports, New Zealand’s largest merchandise imports category in the September quarter, was 3% higher compared to the same time last year. However, sizable seasonal falls over the December 2023 and March 2024 quarters meant that in the year to September imports were still down 5.9%. Within the mechanical machinery category, a notable contribution to the recent rise in imports has been a liftoff in turbojet engines and parts (predominately from the United Kingdom). This jump in turbojet imports in the September quarter was large enough to offset generally weaker imports of other machinery subcategories.
Vehicle imports take a fall as EV’s look to have had a cold start
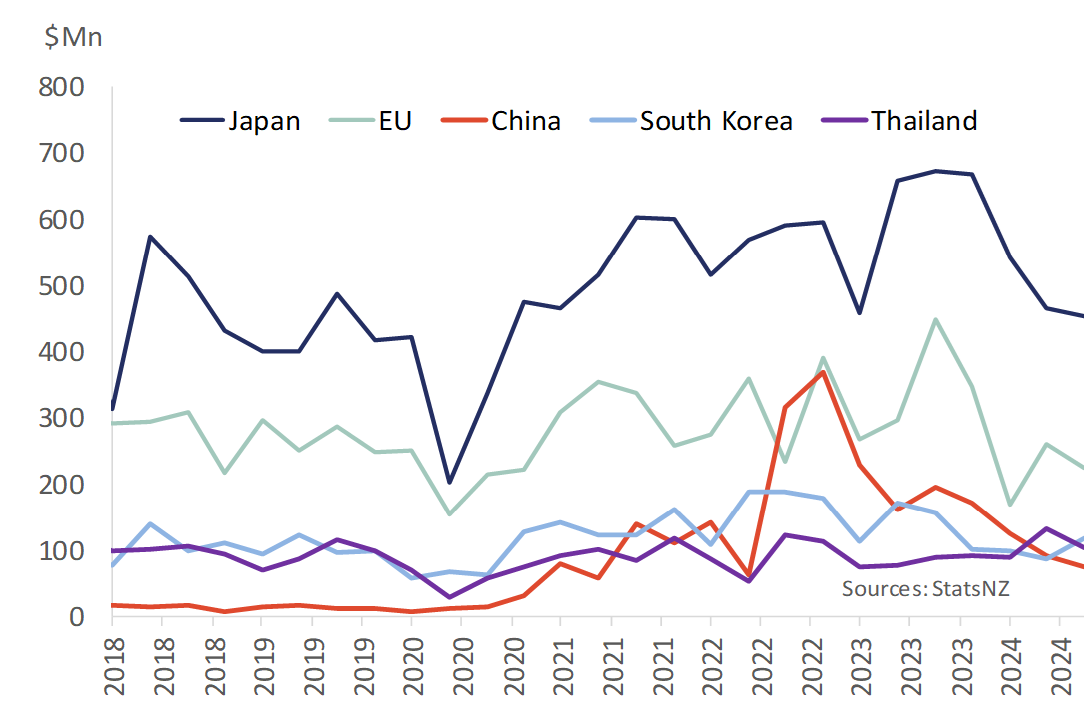
Weighing on goods imports for over a year now has been a noticeable slide in the value of vehicle imports. Since recording a peak of $3.2 billion at the end of 2022, imports of vehicles have fallen almost 40%. This is in part explained by the post-pandemic sluggish economy, driven by high interest rates and rising unemployment rate that has weighed on consumer and business purchases of durable goods. In addition, the end of the clean car discount programme in late 2023 – a programme that provided rebates on newly registered electrical vehicle (EV) purchases – has also dented demand and imports of EVs. The fall in imports of passenger vehicles is most evident in imports from China (see Figure 5 below), which is the largest global producer of EVs. As New Zealand’s economic recovery builds momentum, we would expect to see a turnaround in imports of vehicles.
Figure 5: A cold start? New Zealand’s passenger vehicle imports from top 5 source countries
New Zealand’s trade deficit increases slightly in the September quarter
Overall, New Zealand recorded a trade deficit of $6.52 billion in the September quarter, a slightly larger deficit than the $6.26 billion seen for the same period last year. On an annual basis, New Zealand’s trade deficit lifted a touch to $7.3 billion, but still well down from a peak of $18.3 billion reached in 2022. However, in a familiar story of late, the performance of the annual trade deficit means we have a current account deficit that remains stubbornly high at 6.4% of GDP. A current account deficit of around 2-3% of GDP that is typically seen as a more sustainable deficit and therefore remains a source of vulnerability for the New Zealand economy.
Cautious optimism for the year ahead
New Zealand’s trade performed remarkably well in the face of trade disruptions in 2024. New Zealand exporters and importers were able to navigate changes to global supply chains despite disruptions caused by attacks on shipping in the Red Sea. Shipping costs experienced some wild swings in 2024, and some schedules were thrown out of whack. New Zealand exports still managed to reach markets in Europe. Similarly, and despite temporary disruption for some products (such as pharmaceuticals), New Zealand households and businesses have been able to obtain the products needed.
The September quarter trade data indicates a possible turning point in New Zealand’s trade performance. There are several factors currently at play that are supportive of a future rise in merchandise exports. These include, strengthening commodity prices, a weaker New Zealand dollar, and rising primary sector production in the current season to date. Trading partner growth may only provide a supporting role in lifting exports in 2025, with both the OECD and IMF projecting modest increased in global growth. Nevertheless, policy stimulus announced by Chinese officials in recent months may at least see stability return to demand from our largest trade partner.
However, 2025 comes with a new set of challenges for trade, such as rising trade protection uncertainty exacerbated by a change in US administration. The potential for tit-for-tat tariff hikes between major economies is a key risk to global economic growth and New Zealand’s exports.
More reports
View full list of market reports
If you would like to request a topic for reporting please email exports@mfat.net
Sign up for email alerts
To get email alerts when new reports are published, go to our subscription page(external link)
Learn more about exporting to this market
New Zealand Trade & Enterprise’s comprehensive market guides(external link) export regulations, business culture, market-entry strategies and more.
Disclaimer
This information released in this report aligns with the provisions of the Official Information Act 1982. The opinions and analysis expressed in this report are the author’s own and do not necessarily reflect the views or official policy position of the New Zealand Government. The Ministry of Foreign Affairs and Trade and the New Zealand Government take no responsibility for the accuracy of this report.
Copyright
Crown copyright ©. Website copyright statement is licensed under the Creative Commons Attribution 4.0 International licence(external link). In essence, you are free to copy, distribute and adapt the work, as long as you attribute the work to the Crown and abide by the other licence terms.