Food and Beverage, Primary Products, Services:
On this page
Prepared by the New Zealand Embassy in Brussels.
Note: Given the withdrawal of the United Kingdom from the European Union effective as of 1 January 2020, this trade report does not consider the UK as a part of the “EU”. Occasional reference is made to the “EU28” and the “EU27”. In these cases the former is inclusive of the UK while the latter is not.
Data from: Stats.nz – via Global Trade Atlas for goods)1
Trade Volumes and the Balance of Trade
The following bar graphs show New Zealand’s trade with the EU indicated in blue, relative to our trade with the rest of the world, indicated in red for the year ending June 2020.
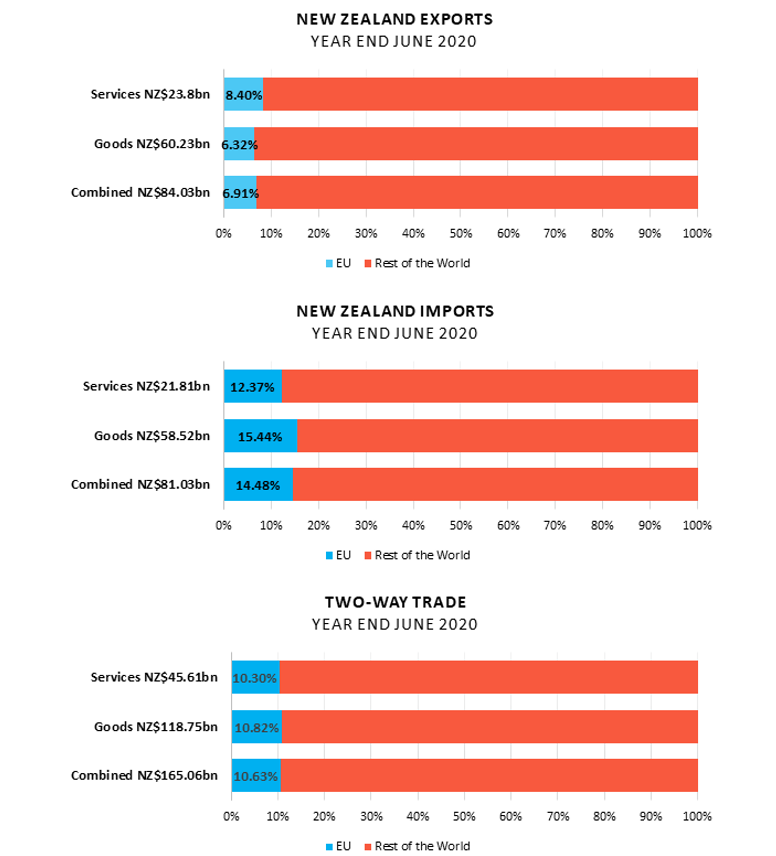
For the year ending in June, the EU was New Zealand’s fourth largest trade partner (for goods and services combined) after China, Australia and the United States. Two-way trade in goods and services declined by 3.5% and was worth NZ$17.55bn. In terms of goods trade the EU was our third largest trading partner after China and Australia. For the year ending in June, New Zealand’s total trade volume with all of our partners declined by 1.76% making this the first year to see a decline in overall trade value since 2015. Goods trade with the EU declined by 5.4% while trade with the UK declined by 3.13%. Trade with China grew by 3.2%.
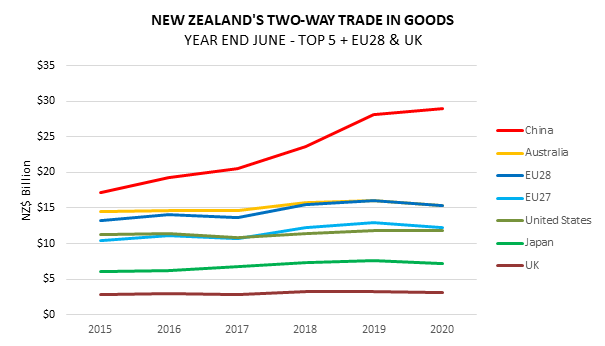
New Zealand exported a total of NZ$3.81bn and imported a total of NZ$9.04bn worth of goods to and from the EU. Adding trade with the UK, New Zealand’s goods exports to the EU28 were worth NZ$5.26bn while imports were worth NZ$10.65bn. The United Kingdom remains in a “transitional period” with the EU until 31 December, meaning that New Zealand goods that have traditionally entered the EU’s Single Market through the UK can continue to do so until the end of the year.
While at this point it is impossible to predict what the future trade relationship between the UK and the EU will look like, it is safe to assume that some of the goods New Zealand currently exports to the UK will in future be exported to continental Europe, increasing the size of our overall goods trade with the EU. New Zealand continued to run a goods trade deficit with the EU that decreased by 5.3% to NZ$5.3bn.

With two-way services trade with the EU worth NZ$4.7bn the EU was New Zealand’s third largest services trade partner well behind Australia (total value NZ$10.62bn) and the United States (total value NZ$7.12bn). Exports were worth NZ$2bn while imports totalled NZ$2.7bn which means that New Zealand ran a services trade deficit of NZ$700m. While in past years New Zealand has run a services trade surplus with the EU28, New Zealand has run a services trade deficit with the EU27 over past years, although this deficit has widened noticeably since 2017 as imports of European services have steadily increased while exports of our services to the EU have largely stagnated.

Goods Exports
For the year ending in June, New Zealand’s global goods exports grew by 1.39%, totalling NZ$60.2bn. In comparison, goods exports to the EU contracted by 4.3% totalling NZ$3.81bn and accounted for 6.3% of New Zealand’s global exports.
New Zealand’s main exports to the EU continued to be: sheepmeat, kiwifruit, optical and medical instruments, fish, and wine which together accounted for over 50% of all exports to the EU. The pie chart below shows a breakdown of our exports by product categories.

Dairy exports to the EU have declined in value by 73.6% compared to the previous year. This is explained by a collapse of butter and cream exports to the EU following a temporary surge in 2019 owing to higher than usual EU butter prices at the time which made our exports more viable. Currently dairy is only the seventeenth most significant product New Zealand exports to the EU and it accounts for less than 2% of exports (see more on dairy below).
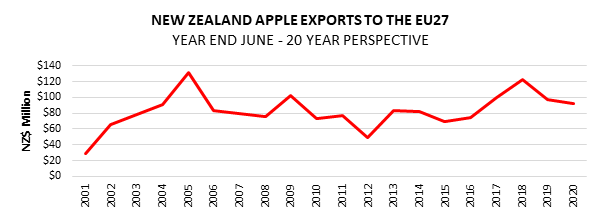
Kiwifruit and apples continue to be New Zealand’s two top horticultural exports to the EU. Kiwifruit exports have shown no sign of slowdown, growing by 12.9% to reach NZ$634m in value. As MPI’s most recent SOPI report notes, the good export season was largely due to the successful completion of the harvests through March to May despite Level 4 lockdown measures. While apple exports declined by 4.4%, this rate of decline is still smaller than it was last year (20.9%) and is not likely to be attributable to the impact of COVID-19, as our apple exports have tended to vary significantly from year to year over the past 20 year period (see below).
Wine exports to the EU have also produced strong growth of 11.6% for the year ending in June totalling NZ$211.3m in value. While traditionally, most of our wine exports to the EU have entered the Single Market through the United Kingdom, exports to the continent have grown at an exponential rate over the past two decades –see below. At present, wine is the fifth most significant product New Zealand exports to the EU.

The fish & seafood sector was one of the hardest hit primary industries by the COVID-19 pandemic as demand for fresh product, particularly lobster in China, fell away dramatically. Despite this, exports to the EU declined by only 2.7%, compared with an overall decline in fish and seafood exports of 6.4%. For the year ending in June, exports stood at NZ$229m. Fish and seafood products are the fourth most significant product we export to the EU and the EU continues to be the third largest destination for our fish & seafood exports after China and the United States.

Global beef exports have grown by 14.6% for the year ending in June, driven by continuing strong demand from China (export growth of 29.5%), from Japan (18.5%) and the United States (10.9%). In contrast, exports to the EU have declined by 32.4%, albeit from a very low base as the market remains constrained by tariffs and quotas. MPI notes that worldredmeat prices generally have “an uncertain outlook” as a result of the COVID-19 pandemic as looming economic recessions could reduce demand for our beef exports around the world (with the exception of China, where demand is expected to stay strong).

The situation is similar for sheepmeat exports. Globally, exports grew by 4.45% for the year ending in June while exports to the EU declined by 10% totalling NZ$730.6m.
During the UK’s “transitional period” New Zealand’s sheep meat Tariff Rate Quota (TRQ) to the EU continues to be administered jointly between the UK and the EU. While the TRQ is administered based on calendar years, for the year ending in June our exports only totalled 85,900 Metric Tonnes, which would translate into a 38% TRQ fill rate. The lowest it has been in the past five years as exports have increasingly shifted to Asian and North American markets.

Dairy Trade
Dairy exports to the EU declined by 73.6% following last year’s surge while imports from the EU grew by 28.7%. As shown in the charts below, this means that for the year ending in June New Zealand ran a dairy trade deficit with the EU of NZ$135m. With the exception of whey exports, which grew by 1.2% all of our dairy exports have declined significantly – milk and cream by 88%, butter by 94% cheese by 98.8% (while dramatic in percentage terms, the quantities involved were low even in year ended 2019 as tariffs and quotas constrain the market – of the 75,000 MT New Zealand butter quota only 1,723 MT was imported in 2019 and none in 2020 to date). On the flipside imports of dairy products from the EU have grown significantly. Cheese imports grew by 19% while milk and cream imports grew by 119%.


Member State points of entry for our goods
The nature of the EU’s single market means that once they have entered, goods can move freely from one Member State to the next (and also freely to and from the UK during the transition period). Nonetheless, as the bar chart below shows for the year ending in June of 2020, 23.2% of all our goods exports entered the EU-27 through Germany. Taken together, Germany and the Netherlands account for over 40% of all goods entering into the EU-27. While the value of our exports to the UK is also depicted in the below table for context, exports to the UK are not calculated as a part of exports to the EU-27.

Goods Imports
For the year ending in June, New Zealand’s global goods imports declined by 4.79% totalling NZ$58.56bn. Imports from the EU also declined by 4.88% and accounted for 15.4% or $9.04bn of all imports entering New Zealand. The main imports from the EU continued to be: machinery & equipment, vehicles, aircraft & parts, pharmaceutical products, electronics, optical & medical instruments, plastics, beverages and dairy products. Together these imports accounted for over 65% of all imports from the EU.

Aircraft & parts imports from the EU declined by 38.8%, which is most likely due to Air New Zealand’s March 2019 decision to defer taking delivery of three Airbus A320neo aircraft.
Following three years of successive growth in import value, the value of vehicle imports for 2019 declined by 12.5% to NZ$1.55bn while the value of machinery imports grew by 3.9% to reach a value of NZ$1.94bn meaning that machinery imports have overtaken vehicles to become the largest import category from the EU. Imports of pharmaceuticals stayed unchanged while electronics imports grew by 4.14% and imports of optical machinery by 3.11%. The value of plastics imports declined by 2.9% while imports of dairy have grown by 28.7%, overtaking beverages to become the 8th largest import category. Despite the decline in vehicle imports, at 23.5% passenger car imports from the EU continued to account for a significant portion of all passenger car imports into New Zealand for the year ending in June.

Services Exports
For the year ending in June New Zealand’s global services exports totalled $23.8bn. Exports to the EU accounted for 8.4% of global services exports, at a value of NZ$2bn. Compared to the year ended June 2019 the value of New Zealand’s services exports to the EU declined by 5%.
Personal, business, and educational travel services along with transportation services (travel related services) accounted for nearly 80% of all services exports to the EU. While transportation service exports grew in value by 0.3%, personal, business and educational travel service exports all declined significantly by 14%, 22% and 23.5%, respectively. Looking beyond travel related services, revenue from insurance and pension services declined by 97.9%, while income from charges for the use of IP rights grew by 239%.


Germany was the single largest destination for our services exports within the EU accounting for 31.41% of all exports albeit exports to Germany declined in value by 18.2% from NZ$874m to NZ$715m compared to the year ended June 2019. In comparison, services exports to the UK declined by 2% for the year ending June 2020.
Services Imports
For the year ending in June New Zealand’s global services imports totalled NZ$ 21.81bn. Imports from the EU accounted for 12.37% of services imports at a value of NZ$2.7bn. Compared to the previous year the value of New Zealand’s services imports grew by 3.8%. Travel related services account for nearly 50% of all service imports form the EU although expenditure on transport services, personal, business and educational travel all declined by 7.4%, 19%, 33.3% and 10.3% respectively.

Looking beyond travel related services, expenditure on cultural services grew by 40% while expenditure on telecommunications and IT services grew by 26.8% and expenditure on other business services grew by 13.8%. Expenditure on European IP rights declined by 5.2% while expenditure on insurance and pension services declined by 35.4%.

[1] Insights on primary industry exports build on the observations made in MPI’s 2020 June(external link) Situation and Outlook for Primary Industries (SOPI) Report. Numbers may not sum exactly due to rounding.
To contact our Export Helpdesk
- Email: exports@mfat.net
- Phone: 0800 824 605
- Visit Tradebarriers.govt.nz(external link)
Disclaimer
This information released in this report aligns with the provisions of the Official Information Act 1982. The opinions and analysis expressed in this report are the author’s own and do not necessarily reflect the views or official policy position of the New Zealand Government. The Ministry of Foreign Affairs and Trade and the New Zealand Government take no responsibility for the accuracy of this report.
